


Monitoring and Billing Service
The proposed monitoring relies on a quite pragmatic implementation based on a set of indicators. The indicators reflect the status and the quality of service of the components of the InGeoCloudS platform. They can be queried at any time, and they are also organized so as to provide the historical monitoring of the platform.
An Indicator is defined through a measure and its technical implementation:
· Measure: the measurable quantity used to detect an event (e.g., the avg. response time); when appropriate the frequency of monitoring or granularity is defined (e.g., every request or every 1 hour); to which extent this measure is available for past time periods (e.g., for the last month vs. for the last year).
· Technical implementation: the technical description of how the measuring is actually implemented (e.g., analysis of the web server log). This may depend on the specific software component being measured or on the cloud platform provider.
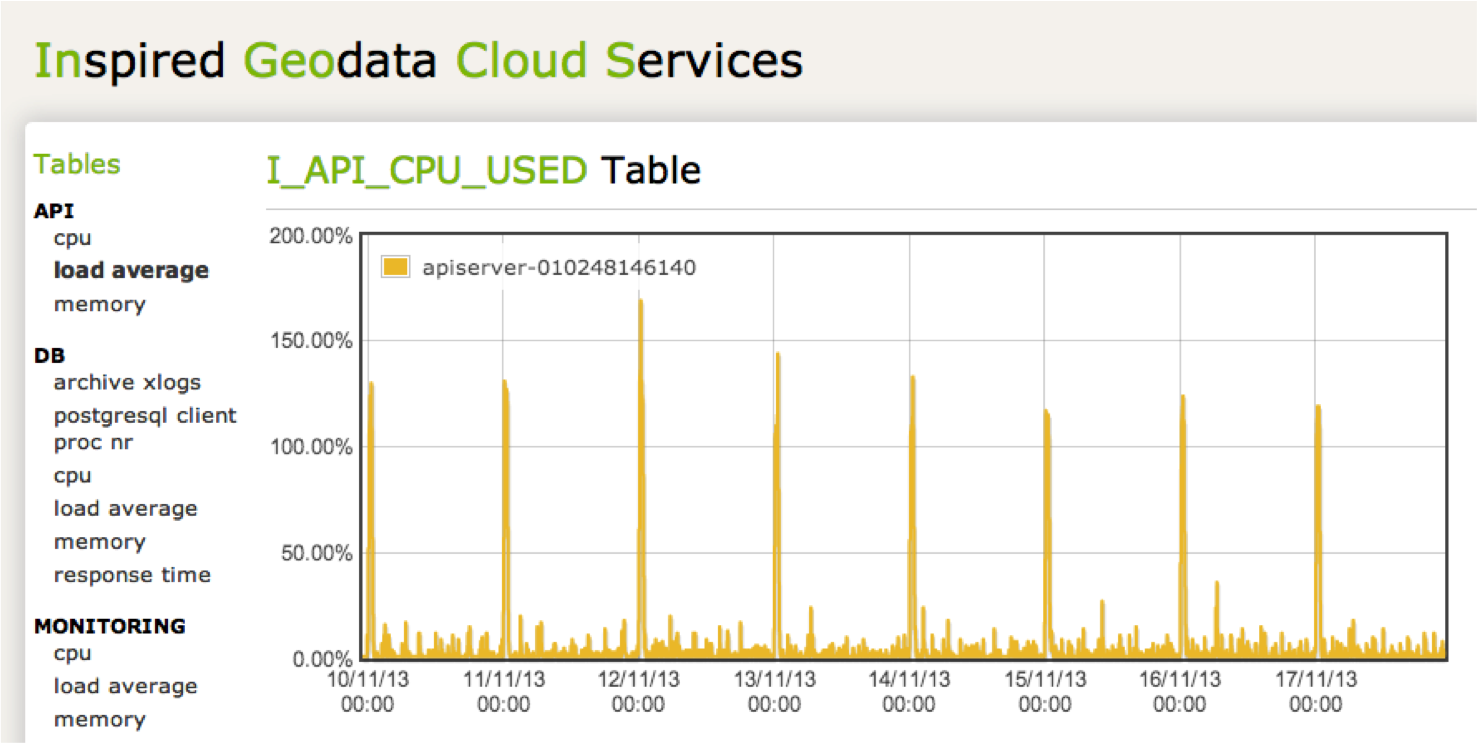
A detailed descrption of each indicator is given in Deliverable D.3.3 "Maintenance Plan and Service Profiling".
In the following we shortly describe the Nagios framework, which we adopted for monitoring the InGeoCloudS platform. Nagios is a scalable and flexible monitoring-system that provides administrator with instant awareness of IT infrastructure issues before they affect critical processes. Nagios architecture is simple and mainly consists of a core, a set of plugins and a set of agents. The core consists of a daemon running on a master node that periodically checks the monitored resources by means of the available plugins. Each plugin enables Nagios to perform a kind of check on a node without installing any software on the node if the check is related to a service which is accessible online (e.g., the availability of a SSH server, HTTP server, FTP server, etc.). If not, for example memory occupancy or disk quota monitoring, check can be performed by installing an ad-hoc agent on the monitored node. In the InGeoCloudS platform, the Nagios core is installed on a dedicated running instance. Each type of agent enables the possibility to perform a type of check on a machine as well as it requires that a proper software is installed on the machine to be monitored. In particular, two packages are needed to enable asynchronous-events monitoring and monitoring of those kinds of metrics (e.g. memory/CPU usage), which cannot be tested directly because they do not expose a service on the network. These packages are: ncsa and nagios-nrpe-server, respectively. The former allows a machine to perform a send to Nagios’ core, the latter allows to process, on the current machine, the requests received by the Nagios’ core by collecting the local data requested. Asynchronous events are an important family of events to consider because they could happen between two consecutive periodical-checks performed by the Nagios’ core without noticing (e.g. machine reboot event). Finally, monitoring of a resource, like CPU or memory, cannot be monitored without performing a “script” on the remote monitored machine and returning the related data by means of a formalism that can be interpreted by di monitoring system.
A further issue is to define an approach for monitoring those events that change the set of machines. In particular when a new machine is instantiated or an existing machine is removed the monitoring system should be able to grab such an event. To this end, asynchronous events can be exploited. By adding an sca-send to those scripts that are automatically run when a linux-machine is “switched” on/off, we can enable the capability to notify these events to Nagios. An alternative solution is to install a proper add-on that enables the “auto discovery” capability on Nagios by scanning a subnet for hosts that Nagios is not monitoring.
Finally, the Nagios server has been modified so as to store all the indicators data into an Amazon RDS instance. This allows to access, query and analyze the behaviour of the platform at any point in time, even when the platform is not running. A specific web interface has been developed and it is hosted on the Nagios instance.
Customer Data Record and their exploitation are progressively put in place as soon as the Pilot-2 is operational. The accounting is based on both indicators as described above, and processing of application logs. In fact, by analysing the web server application log, the database application log, and some others, it is possible to estimate the usage of a given service for each given user. During the Pilot-2 exploitation we will evaluate the accuracy of such mechanisms, and select a few information sources that provide the best estimates for per-user accounting and billing. During first months of operation, possible consortium’s external data providers receive free usage of the platform and the consortium will evaluate the goodness of the accounting information delivered to the InGeoCloudS users.
Billing will instantiate the policies decided at Consortium level and discussed in the exploitation plan. This includes categorization of users and services in order to define the most appropriate billing plan. We will also verify the coherence of collected records with other technical indicators.
Currently, the platforms takes advantage of Amazon Tagging and Advanced Billing tools so as to measure the cost of each service provided by the platform (e..g, Elastic DB, Elastic FS). This is most useful to the administrator of the platform in order to measure the resource consumption and cost of each service. Also, Accounting API return a description of the costs incurred by each data provider detailed per each service. The share of cost of is based on actual resource usage (e.g., disk space) and on application log analysis (e.g., map server/apache access logs) to estimate the usage of indivisible resources (e.g., Web Server). The description of the accouting API is provided at the following URL Accounting Service API.
- Log in to post comments
Last updates
Project's Calendar

Only for consortium members
Contact: you can contact the Consortium using the generic address: contact [@] ingeoclouds.eu. Thanks!
This project is partially funded by the European Commission CIP Program. This website reflects the views of the authors only, and the Commission cannot be held responsible for any use which may be made of the information contained therein.

InGeoCloudS Users Documentation and other documents of this Web
site by the InGeoCloudS consortium members
are licensed under a Creative Commons Attribution-NonCommercial-ShareAlike 3.0 Unported License.
Based on a work at http://www.ingeoclouds.eu/.
Ad banners and pictures are (c) AKKA Technologies