


Publish Geo-Datasets
On this page you can find following main sections for Publication of Geo-Datasets:
Alternatively some videos are available: 'create a map' and 'create INSPIRE services'
1. How to access the ftp Server
When you open an InGeoClouds account, you will be assigned a storage space
To access storage, use an FTP client-server, such as:
- FileZilla [downloadable from https://filezilla-project.org/download.php?type=client]
- Cyberduck for Mac [downloadable from http://cyberduck.fr/]
- WinSCP [downloadable from http://winscp.net/eng/download.php]
- Or any other.
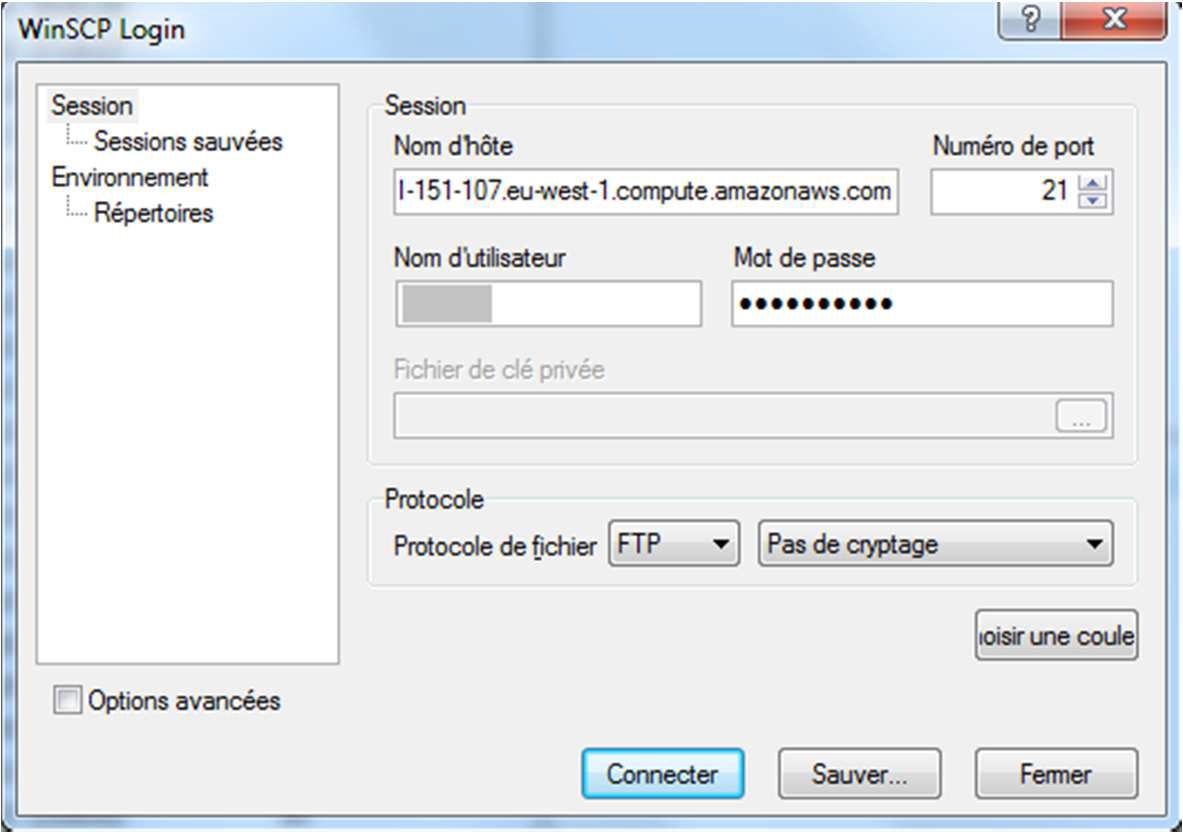
Once the FTP client-server is installed, open a new session and fill in the following fields:
- User Name = your InGeoClouds account name
- Password = your InGeoClouds account password
- Host name = ec2-46-51-151-107.eu-west-1.compute.amazonaws.com
Then Connect.
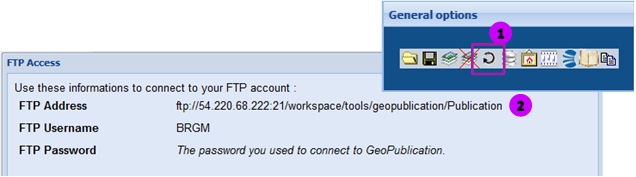
1.1 Get FTP Address
- Connect to the application. Follow Chapter II. 1.
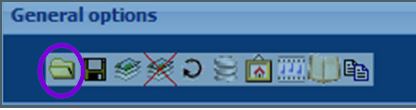
- Click the «Show the FTP upload… » icon accessible from the « General options ».toolbar (1).
- Then, the new window indicates the address of the FTP (2).
2. Folders /Directories Structure
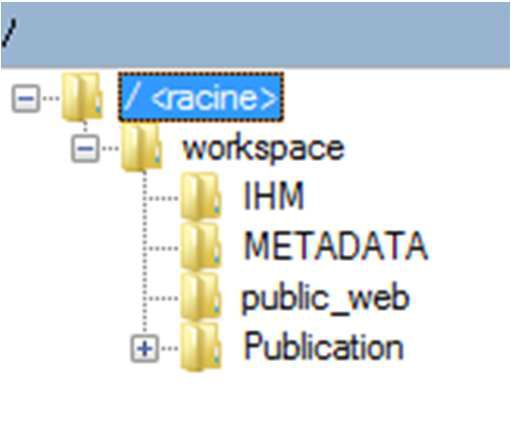
Once the FTP space has been created, a “Workspace” directory containing 4 sub-folders “IHM, METADATA, Publication and public_web” will be activated.
- IHM : personalization features of your map (banner, layout, logo, etc..) will be stored here.
- METADATA : to keep html or pdf documents associated to data layers or layer fields (for instance : information sheet or metadata sheet).
- Publication : the space where all SIG data must be stored. Maps produced from the map creation interface as well as the application configuration files are also stored here.
- Public_web: allows to file documents used outside the mapping perimeter under InGeoClouds.
3. Deposit data
3.1 SIG data
- Access the « Publication » folder of the FTP directory.
- Create a new folder there by right-clicking / « Create a folder” to deposit your SIG data. Please note: you are allowed to create several folders or sub-folders.
- Next, open this new directory.
- From the FTP client-server, now access the fileset directory tree of your personal computer.
- Select the set of SIG files for copy.
- And copy them on the new directory of the FTP space. To do this, select the files and drag and drop them in the folder or else, right-click on the files and select « Send » (depending on the client chosen).
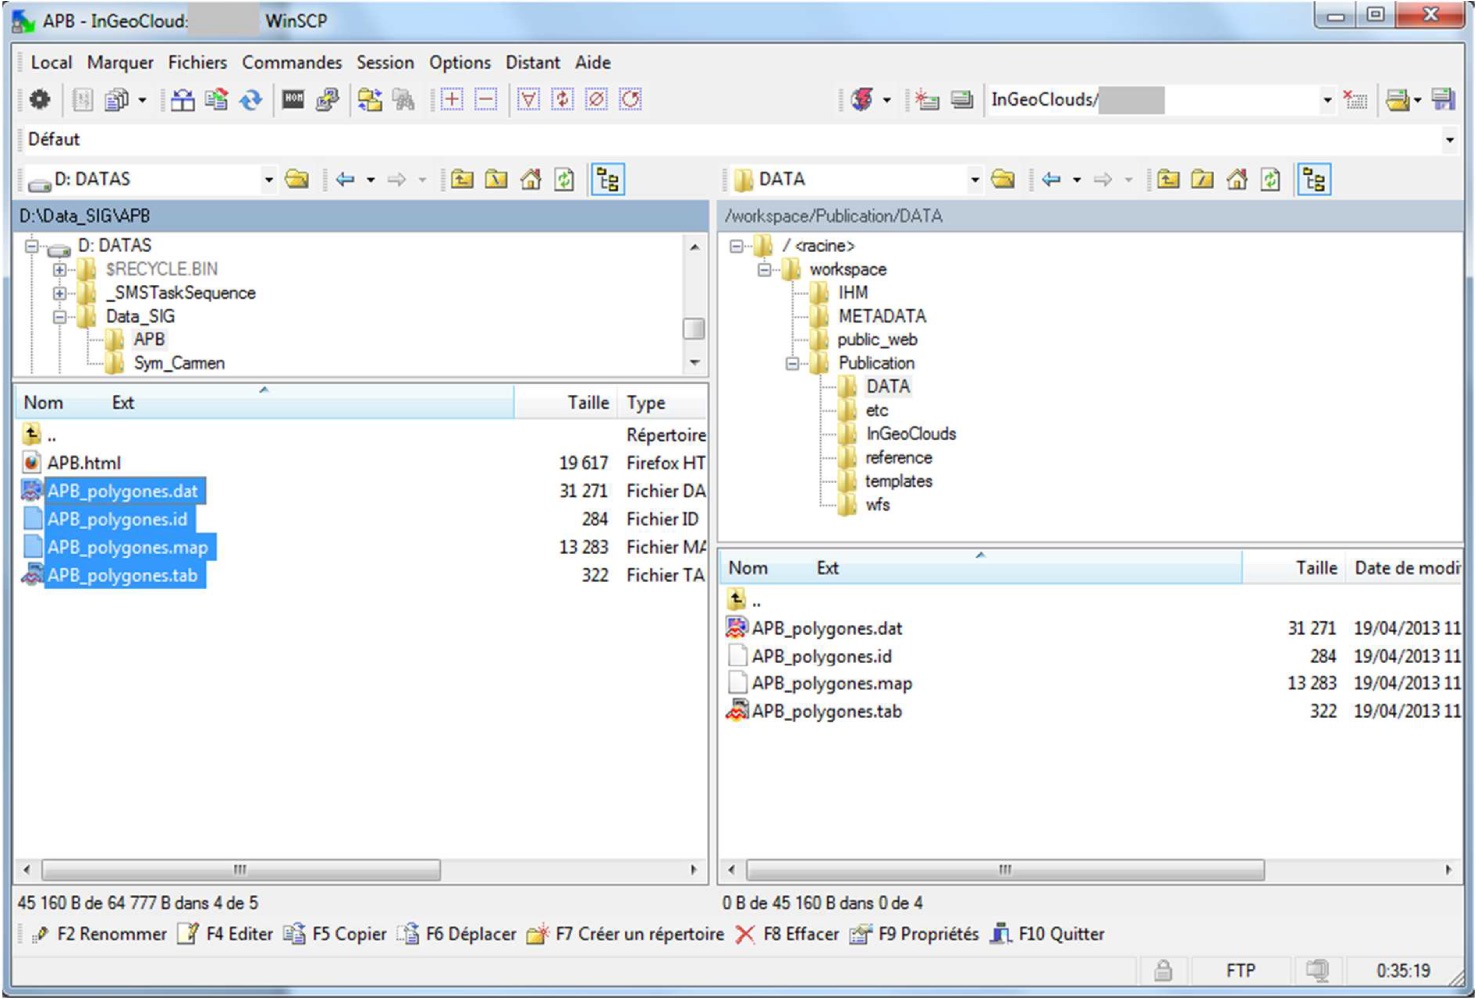
From then on, SIG data will be copied onto the FTP storage space and directly accessible from the InGeoClouds map creation interface.
3.2 Documents linked to maps
Documents linked to SIG data (metadata sheets or any other) should be identically copied in the METADATA/Publication folder of the FTP space.
Remark
- Directories and configuration files should never be moved/modified/ suppressed.
-> File path to data is “predetermined” in the *.map files, for map configuration. If data files are modified, then it will not be possible to open *.map files anymore.
- When creating new directories, please make sure you do not use any accent or special character. Besides, the titles names: Banner, Metadata, reference and etc are absolutely forbidden.
You may watch the 'create first map' (click here) video or watch the 'create INSPIRE web services' (click here) or read the following:
1. Access to the map creation interface
The InGeoClouds GeoPublication interface is accessible through the following url :
http://portal.ingeoclouds.eu/sitools/client-user/GeoPublication/project-...
To connect :
- Open a web browser.
- Copy the above url.
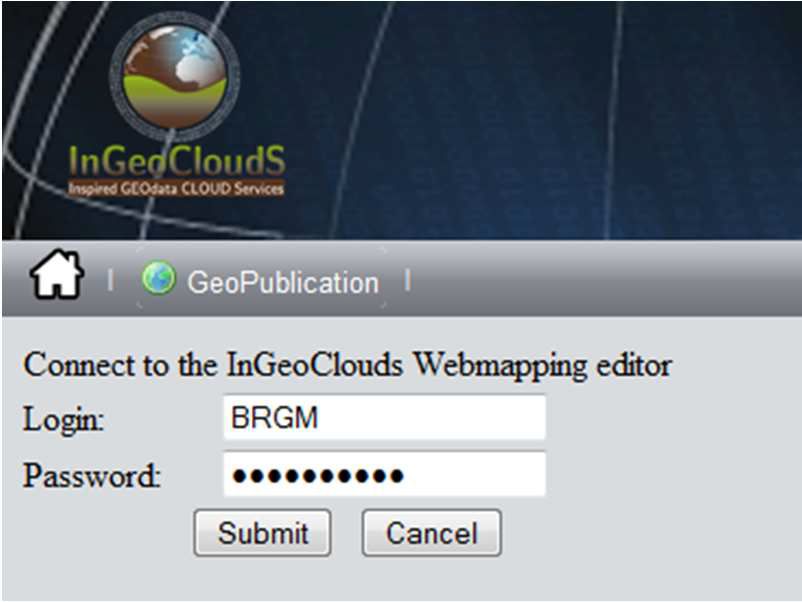
- Click the « GeoPublication » button (1).
- Then, enter the login (2) and password (3) provided upon your account creation.
- Finally, click « Submit » (4).
You are then logged onto the InGeoClouds Webmapping Editor.
2. Open, delete, create and save a map
2.1. Open

No action is allowed unless a map is opened.
To open a map:
- Click the « Open… » icon accessible from the « General options ».toolbar
- Select the requested file in the list (1).
- And click the « Open » button (2).
2.2 Delete
If needed, it is possible to delete a map as follows:
- Click the « Open … » button accessible from the « General options » toolbar.
- Select the file you wish to suppress from the list.
- Then click the button  which is displayed on top of the
window « browse files » (3).
which is displayed on top of the
window « browse files » (3).
2.3 Create
For any map creation job, the first step is to open a pre-existent map. You can then decide to start from any already existent map or from the “default” map: templateINGC.map.
The latter offers a base map by default and is configured to natively accept SIG data in European Terrestrial Reference System 1989 (ETRS89 [EPSG:4258]) projection. If necessary, the projection system can be modified at a later stage (see next point).
- Click the « Open … » button available from the « General options » toolbar.
- Select the file « templateINGC.map » in the list.
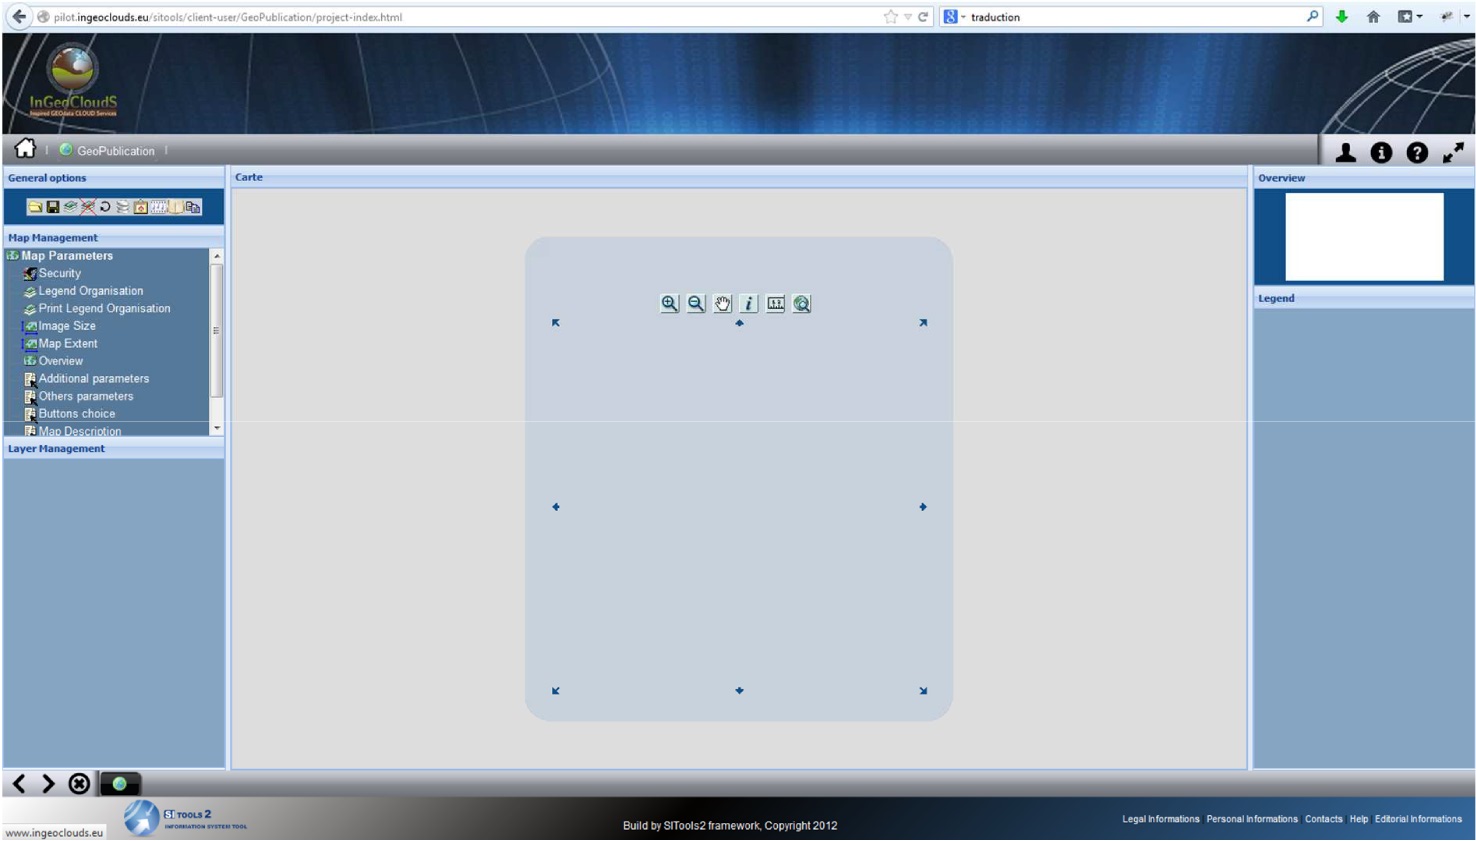
- Then click the « Open » button to get onto the screen below:

(1): Map (2): Overview (3): Legend
(4): General options (5): Map management (6): Layer Management
2.4 Save a map
Next, save your map with a new filename.
- Click the « Save … » button available in the « General options » toolbar (1).
- Modify the filename *.map in « File » (2). Attention! Do not use any special characters.
- Then click « Save » (3).

Precisions:
▪For information, this name is not the title of the map but the actual name of the *.map file. This name will then be displayed in the URL of your map consultation interface and for the generation of web services. It is the reason why you should not use any special character, accent, blank space nor dash, which would prevent proper reading of the filename.
▪The file *.map is not automatically saved. It is therefore necessary to regularly save it when creating a map.
3. Fill in map information
3.1 Set up parameters for the map title and projection system
By default, the templateINGC.map map-title is: « InGeoClouds: Empty map » and it is projected in ETRS89. These variables can be modified as follows:
- From the « Map Management » block, click the « Other parameters » function (1). It will open the « Map options » window (2).
- Modify the title « InGeoClouds : Empty map » with a title of your choice, it will then be displayed in the “Map Name”cell for the map options area (3).
- Next, in the list « Projection reference system », select the chosen projection (4).
- And click « OK » (5).

3.2 Fill in INSPIRE parameters
Cf chapter III. 1.
4. Integrate SIG data layers
InGeoClouds Webmapping allows you to integrate the following types of SIG data:
▪ Data stored in files:
- MapInfo native data (.tab)
- MapInfo export data (MIF/MID)
- ArcView native data (.shp)
- Unique Raster data (.tif, .ecw)
- Tiled Raster data
▪ Data stored in a database:
- table PostGIS
▪ Data accessible via Web Services:
- WMS feed
- WMS-C feed
- WFS feed
Precisions :
In the InGeoClouds Webmapping, the data layers can be defined in a projection system different from the map one.
4.1 Integrate vector data

To add vector data:
- Click the « Add a layer … » button available on the « General options » toolbar (1).
- In the new window, click « Add a layer type» and choose « Vector layer (SHP, TAB, MIF/MID) » in the drop-down menu (2).
- Select the projection system of the added data (it can be different from the map one) (3).
- Click « Choose… » (4).
- Then browse the files of your FTP storage space, and select the desired vector data (select and click «Open ») (5).
- Next, enter the alias of the data layer (the name it will take when displayed in the map) (6).
- Then confirm by clicking « Add » (7).

The layer is then shown in the map of the map creation interface, in the menu « Layer Management » situated in the left column and in the « Legend » menu situated in the right column.

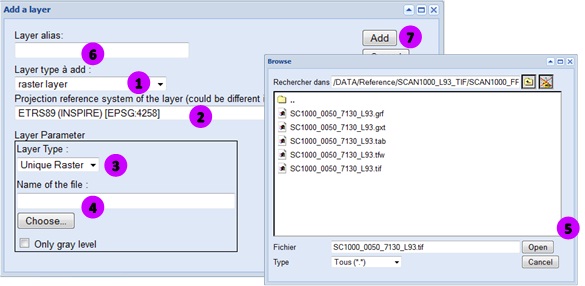
4.2 Integrate raster data
To integrate raster data, the process is the same as previously detailed.
- Click the « Add a layer … » button available on the « General options » toolbar (1).
- In the new window, click « Add a layer type » and choose « Raster layer» in the drop-down menu (1).
- Select the projection system of the added data (it can be different from the map one) (2).
- Indicate the « Layer type » (3) : Unique raster or Tiled raster.
- Then click « Choose… » (4).
- Select the desired raster data (select and click «Open ») (5).
- Next, enter the alias of the data layer (i.e. the name that will be displayed in the map) (6).
- Then validate by clicking « Add » (7).
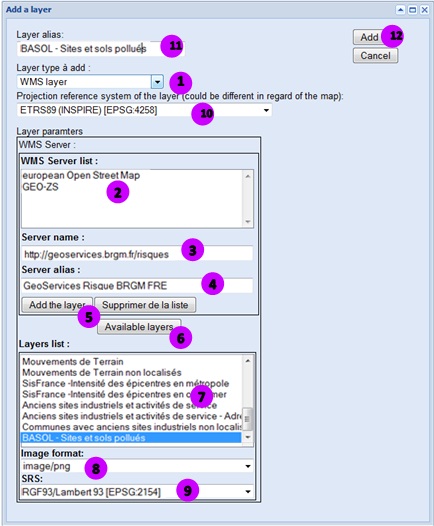
4.3 Integrate WMS flows
InGeoClouds Webmapping allows you to integrate SIG data from WMS or WFS feed.
To integrate a layer coming from a WMS flow to your map, please proceed as follows:
- Click on the « Add a layer … » button available in the « General options » toolbar.
- In the new window, click « Add a layer type » and choose « WMS layer» in the scrolling menu (1).
- Select an existent WMS server in the list (2) or add a new one. In this case, enter the URL of the server (3), feed in the chosen alias (4) and save it by clicking « Add the layer » (5).
- >Once the server is selected, click « Available layers » (6). The list of layers is displayed below, in the space provided (7).
- Select a WMS layer of your choice (7).
- Then choose the parameters. Select the output image format (8) and the projection system of the SRS display (9).
- Select the projection system of the added data (it can be different from the map one) (10).
- Next, enter the alias of the data layer (i.e. the name that will be displayed in the map) (11).
- Validate by clicking « Add » (12).
Precisions:
• The WMS servers yourself added in the list of servers will be kept available for all your maps.
• In the available layer list, some lines may not match with single layers but with group of layers. In this case, the SRS default parameter is not available. This scenario is not managed in the application; as a result you will not be able to add them to a map.
• For a high quality picture, it is advisable to use the following image formats:
- PNG for image scans,
- JPEG for orthophotography.
4.4 Integrate WFS flows

The process is the same as for a WMS flow.
- Choose a « WFS layer » in « Add a layer type » (1).
- Next, a complementary parameter has to be entered: the entity type. Select « point », « Line » or « Surface » depending on the layer type requested (2).
5. Set the layer parameters

Once data have been added to your map, it is possible to set parameters for each one of them, scrolling the various functionalities from the « Layer Management » block.
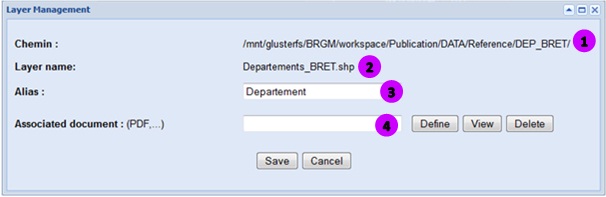
5.1 Layer Management
This functionality indicates :
- The path used by the data (1),
- The name of the data (2),
- The Alias of the data. This is the place where it can be modified (3).
This function allows:
- To associate a document , in *.pdf, *.doc or *.html formats (4), which you will have previously inserted in the sub-file /METADATA/Publication of your storage space , and will be accessible, from the consultation site, by clicking the name of the layer in legend .
5.2 Symbology
5.2.1 Simple symbology
This functionality allows the modification of the default symbology for a layer.
The layer object appearance can be thoroughly modified for the vector layers while for rasters and WMS/WFS feeds, only transparency will be available for change.
- From the « Layer Management » block, click the + situated on the left of the layer then on « Symbology ».
- In the new window, choose the type of symbology (unique symbol, Analysis for unique value, Analysis for graduated colors, Analysis for graduated symbols, analysis for proportional symbols or Sector Analysis, Sector Analysis) (1).
- Click « Set parameters » (2).
- Next, set the parameters for the various options:
▪ Name = name of the class of object in the legend (3).
▪ Background pattern = click to choose the symbol, pattern or line (depending on the entity type of the layer) (4).
▪ Color of the object = Click to choose the colour of the object (5).
▪ Outline color = Click to select the colour of the object outline (6).
▪ Thickness Outline = determine the thickness of the outline, can be set to 0 (7).
▪ Transparency = pourcentage of transparency applied to the layer by default (8). The rate can then be modified by the user from the consultation interface. .
- Click « Ok and close » to apply the symbology to the layer (9).

Precisions :
When dealing with a MapInfo vector layer and the functionality « Symbology » is activated for the first time, a dialogue box will open and you will be requested to select the geometry type of the layer (Point, Line or Area).
6. Layer Organisation
6.1 Simple legend organisation


Because of the integration order, it is often necessary to modify the display order of the layers in the map. To modify the layer order, proceed as follows:
- In the « Map Management » block, click « Legend Organisation » (1).
- When the window opens, select, clicking the name of the desired layer.
- Next, click « Up the layer » or « Down the layer » (2), to place it in the requested position with regard to the other layers.
- Eventually, click « Save » (3) to apply the new organisation to the map.
7. Customise the map consultation interface
InGeoClouds Webmapping Editor allows you to customize the interface and tools of the maps you have created.
Customization is only applied to the map which you are working on and does not affect any other map created on the same account. A specific configuration is associated to each map.
7.1 The consultation interface features and tools

To select and modify the features and tools available by default:
- From the « Map Management »block, click the «Buttons choice » function.
- In the sections « Design the view interface » and « Tools », tick or untick the map features and tools according to your needs.
- Confirm your choice clicking « OK ».

Recommendations:
To help you creating maps further on and thus avoid building the same interface up several times, it is advised to create a “base” map which will keep all the interface parameters and reference systems (map backgrounds) saved in. You will then use this base-map to set up new maps.
8. Visualising the map and knowing its URL

Once the map has been saved and the parameters set up, it is possible to view it on the consultation interface.
- Click on « Check the map in Geoview » from the « General Options » menu (1).
- In the new window, click on the link "URL of the map".

A new window is opened on your web browser and the map, its content and customized consultation interface is displayed (2) :

The address of your map is the address displayed in your browser. It is made up as follows:
http://geopublication.ingeoclouds.eu/front//[name_account]/[name_map].map (3).
III. Create an INSPIRE web service
1.
Configuration of common elements 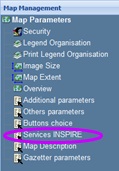
First, from your map, set up the « Services INSPIRE» parameters.
- Click on the function “Services INSPIRE” accessible from the “Map Management” block.
- Select the projection systems that will, by default, apply to all the layers distributed in WMS/WFS (1), clicking on the chosen projection and then on the double-arrow button
- Enter an abstract on the distributed service (2).
-
Specify the following entries :
- Service language (3)
- Usage limitations (4)
- Access constraints (5).
- Then, enter the contact information parameters (service contact) (6).
- Finally click on the “confirm” button to validate (7).
It is possible to modify these values at any time by clicking on this function again.
Explanations :
These parameters allow feeding mandatory fields of the generated web-services as well as the service metadata forms produced by the application.
2. Link a GeoNetWork metadata form
2.1 Create a metadata form
Two possibilities are offered:
- Either creating a pre-completed metadata form from the application and then fill it from the GeoNetWork account.
- Or select a pre-completed form from the associated GeoNetWork account.
The second method has to be favored.
Proceed as follows:
-
 Access the associated
GeoNetWork account by clicking on the « GeoNetwork access » button available from
the « Map Management » block (1)
Access the associated
GeoNetWork account by clicking on the « GeoNetwork access » button available from
the « Map Management » block (1)
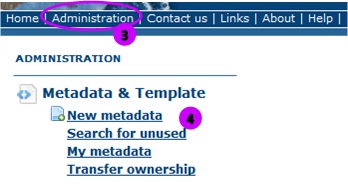
- Next, from the GeoNetwork homepage, log in, clicking on the « Login » button (2).
-
Finally, from the « Administration » function (3), click on « New Metadata » (4).
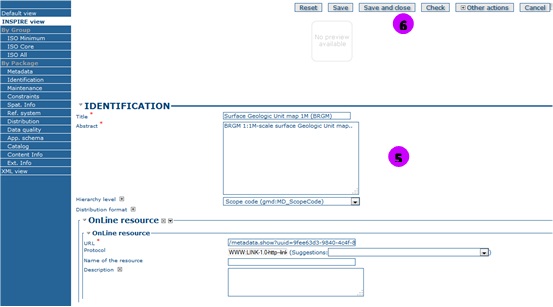
- Select the chosen template, and click on « Create ».
- Fill in the metadata file (5) and save it (6).
2.2 Link a metadata file to data.
 From the
« Layer Management » function associated to each layer, it is possible to link a
metadata file.
From the
« Layer Management » function associated to each layer, it is possible to link a
metadata file.
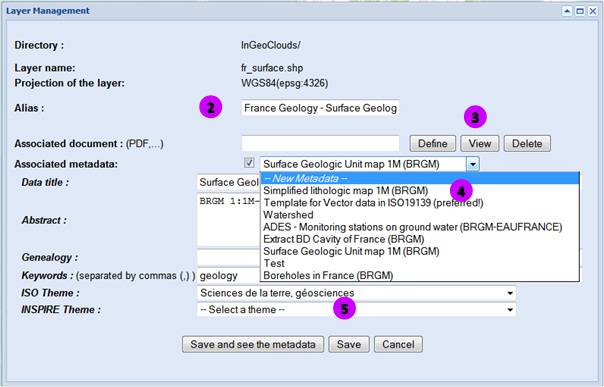
- Drop down the options of the chosen layer then click on« Layer Management » (1).
- In the new window, tick the « Associated metadata » option (2), then drop down the metadata list of data created in the linked GeoNetWork account (3).
- Select the metadata form corresponding to the layer (4).
- Finally, save your choice clicking on “Save” (5).
Explanations :
It is absolutely essential to create a metadata file and link it with a data layer (that will then be distributed as a web-service) when generating INSPIRE web-services. The INSPIRE web-services must provide a link to the metadata forms of the data they are composed of, as well as to their service metadata forms.
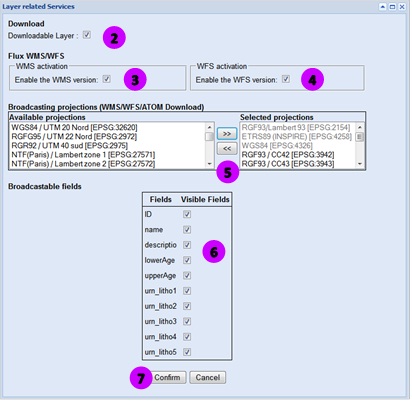
3. Make layers accessible
 It
is possible to distribute SIG data layers of the map in WMS / WFS flows and make them
accessible for simple download. Besides, it is possible to select searchable fields
and supported projection systems.
It
is possible to distribute SIG data layers of the map in WMS / WFS flows and make them
accessible for simple download. Besides, it is possible to select searchable fields
and supported projection systems.
- From the « Layer Management » block , first click on the + situated on the left of the layer header then on «Related Services» (1).
- Tick the layer activation for download (2), WMS (3) and/or WFS (4) distribution, depending on your needs.
- Select one or more projection system to distribute this layer: click on the requested projections in the list on the left, then click on the « >> » button (5). Please note : the INSPIRE SRS selected in the « Services INSPIRE » function have by default been transposed to the data layers.
- Next, select the fields that can be searched (6).
- Finally, click on « Confirm » (7).
Please note :
▪ The WMS and WFS parameters are stored in a wms_[map_name].map file in your FTP server.
▪ To have operating download and WMS/WFS services, it is COMPULSORY never to use accents in the field names, or in the file or directory names. The dash [6 key] "-" should not be used either in the name of the « .map » file when saving one’s map, otherwise access to flows cannot be achieved.
Explanations :
This stage allows generating INSPIRE spatial data web-services: simple visualization (WMS 1.3.0) and download (ATOM) as requested in the directive, as well as the direct download (WFS 1.1.0). Only configured layers will be made available in the selected web-services.
4. Find the distribution url.
 Once the map has been
saved, you may consult and share the url of the generated web-services and of the
services metadata forms generated by the application.
Once the map has been
saved, you may consult and share the url of the generated web-services and of the
services metadata forms generated by the application.
- Click on « Check the map in Geoview » from the « General Options » menu (1).
-
In the new windows, by clicking on each item in the list of url displayed, it is
possible to access:
- map (2),
- visualisation service (WMS) and linked service metadata form (3),
- direct download service (WFS) and linked service metadata form (4),
- simple download service (ATOM) and linked service metadata form (5).
- Log in to post comments
Last updates
Project's Calendar

Only for consortium members
Contact: you can contact the Consortium using the generic address: contact [@] ingeoclouds.eu. Thanks!
This project is partially funded by the European Commission CIP Program. This website reflects the views of the authors only, and the Commission cannot be held responsible for any use which may be made of the information contained therein.

InGeoCloudS Users Documentation and other documents of this Web
site by the InGeoCloudS consortium members
are licensed under a Creative Commons Attribution-NonCommercial-ShareAlike 3.0 Unported License.
Based on a work at http://www.ingeoclouds.eu/.
Ad banners and pictures are (c) AKKA Technologies